使用Prometheus和Grafana做可视化大屏展示

开发大屏可视化图表展示模块是一个庞大而复杂的工程, 后端预埋节点收集统计数据库,
同时要处理统计原始数据,提供给前端图表数据API,
前端在根据API调用echart等js图表库做可以视化展示.
对于后端来说数据统计分析是一个庞大而复杂的工程.和前端一起联调API更是一项复杂工作.
但是这里有一个简单快捷的方法生成可视化图标
1.Prometheus是一款开源的业务监控和时序数据库
如果您搜索prometheus可以找到无数的教程关于怎么运维安装集群监控系统.
但是这篇教程将是教您如何怎么利用prometheus友好的文档和监控metric(监控指标)在加使prometheus内置的时序数据库,
来开发业务统计系统.
2.Prometheus Metrics类型
为了能够帮助用户理解和区分这些不同监控指标之间的差异,Prometheus定义了4中不同的指标类型(metric type):Counter(计数器),Gauge(仪表盘),Histogram(直方图),Summary(摘要).
Counter:只增不减的计数器
Counter类型的指标其工作方式和计数器一样,只增不减(除非系统发生重置).常见的监控指标,如http_requests_total,node_cpu都是Counter类型的监控指标. 一般在定义Counter类型指标的名称时推荐使用_total作为后缀. Counter是一个简单但有强大的工具,例如我们可以在应用程序中记录某些事件发生的次数,通过以时序的形式存储这些数据,我们可以轻松的了解该事件产生速率的变化.PromQL内置的聚合操作和函数可以用户对这些数据进行进一步的分析: 例如,通过rate()函数获取HTTP请求量的增长率:
rate(http_requests_total[5m])
查询当前系统中,访问量前10的HTTP地址:
topk(10, http_requests_total)
Gauge:可增可减的仪表盘
与Counter不同,Gauge类型的指标侧重于反应系统的当前状态.因此这类指标的样本数据可增可减.常见指标如:node_memory_MemFree(主机当前空闲的内容大小),node_memory_MemAvailable(可用内存大小)都是Gauge类型的监控指标.
通过Gauge指标,用户可以直接查看系统的当前状态:
node_memory_MemFree
对于Gauge类型的监控指标,通过PromQL内置函数delta()可以获取样本在一段时间返回内的变化情况.例如,计算CPU温度在两个小时内的差异:
delta(cpu_temp_celsius{host="zeus"}[2h])
还可以使用deriv()计算样本的线性回归模型,甚至是直接使用predict_linear()对数据的变化趋势进行预测.例如,预测系统磁盘空间在4个小时之后的剩余情况:
predict_linear(node_filesystem_free{job="node"}[1h], 4 * 3600)
使用Histogram和Summary分析数据分布情况
除了Counter和Gauge类型的监控指标以外,Prometheus还定义分别定义Histogram和Summary的指标类型.
Histogram和Summary主用用于统计和分析样本的分布情况.
在大多数情况下人们都倾向于使用某些量化指标的平均值,例如CPU的平均使用率,页面的平均响应时间.这种方式的问题很明显,以系统API调用的平均响应时间为例:如果大多数API请求都维持在100ms的响应时间范围内,而个别请求的响应时间需要5s,那么就会导致某些WEB页面的响应时间落到中位数的情况,而这种现象被称为长尾问题.
为了区分是平均的慢还是长尾的慢,最简单的方式就是按照请求延迟的范围进行分组.例如,统计延迟在0~10ms之间的请求数有多少而10~20ms之间的请求数又有多少.通过这种方式可以快速分析系统慢的原因.Histogram和Summary都是为了能够解决这样问题的存在,通过Histogram和Summary类型的监控指标,我们可以快速了解监控样本的分布情况.
例如,指标prometheus_tsdb_wal_fsync_duration_seconds的指标类型为Summary. 它记录了Prometheus Server中wal_fsync处理的处理时间,
通过访问Prometheus Server的/metrics地址,可以获取到以下监控样本数据:
# HELP prometheus_tsdb_wal_fsync_duration_seconds Duration of WAL fsync.
# TYPE prometheus_tsdb_wal_fsync_duration_seconds summary
prometheus_tsdb_wal_fsync_duration_seconds{quantile="0.5"} 0.012352463
prometheus_tsdb_wal_fsync_duration_seconds{quantile="0.9"} 0.014458005
prometheus_tsdb_wal_fsync_duration_seconds{quantile="0.99"} 0.017316173
prometheus_tsdb_wal_fsync_duration_seconds_sum 2.888716127000002
prometheus_tsdb_wal_fsync_duration_seconds_count 216
从上面的样本中可以得知当前Prometheus Server进行wal_fsync操作的总次数为216次,耗时2.888716127000002s.其中中位数(quantile=0.5)的耗时为0.012352463,9分位数(quantile=0.9)的耗时为0.014458005s. 在Prometheus Server自身返回的样本数据中,我们还能找到类型为Histogram的监控指标prometheus_tsdb_compaction_chunk_range_bucket.
# HELP prometheus_tsdb_compaction_chunk_range Final time range of chunks on their first compaction
# TYPE prometheus_tsdb_compaction_chunk_range histogram
prometheus_tsdb_compaction_chunk_range_bucket{le="100"} 0
prometheus_tsdb_compaction_chunk_range_bucket{le="400"} 0
prometheus_tsdb_compaction_chunk_range_bucket{le="1600"} 0
prometheus_tsdb_compaction_chunk_range_bucket{le="6400"} 0
prometheus_tsdb_compaction_chunk_range_bucket{le="25600"} 0
prometheus_tsdb_compaction_chunk_range_bucket{le="102400"} 0
prometheus_tsdb_compaction_chunk_range_bucket{le="409600"} 0
prometheus_tsdb_compaction_chunk_range_bucket{le="1.6384e+06"} 260
prometheus_tsdb_compaction_chunk_range_bucket{le="6.5536e+06"} 780
prometheus_tsdb_compaction_chunk_range_bucket{le="2.62144e+07"} 780
prometheus_tsdb_compaction_chunk_range_bucket{le="+Inf"} 780
prometheus_tsdb_compaction_chunk_range_sum 1.1540798e+09
prometheus_tsdb_compaction_chunk_range_count 780
与Summary类型的指标相似之处在于Histogram类型的样本同样会反应当前指标的记录的总数(以_count作为后缀)以及其值的总量(以_sum作为后缀). 不同在于Histogram指标直接反应了在不同区间内样本的个数,区间通过标签len进行定义. 同时对于Histogram的指标,我们还可以通过histogram_quantile()函数计算出其值的分位数. 不同在于Histogram通过histogram_quantile函数是在服务器端计算的分位数. 而Sumamry的分位数则是直接在客户端计算完成.因此对于分位数的计算而言,Summary在通过PromQL进行查询时有更好的性能表现,而Histogram则会消耗更多的资源. 反之对于客户端而言Histogram消耗的资源更少.在选择这两种方式时用户应该按照自己的实际场景进行选择.
3.集成prometheus数据收集到服务中
因为我是一个倾向简洁直观开发者,不希望我主导开发的服务器,依赖多种语言和各种各样的其他服务.所以我就把自定义prometheus exporter 并且集成到自己的业务服务器中.
接下来老周就详细讲解怎么在golang以有的业务中集成prometheus exporter自定义数据收集功能. 在这之前您可以先参考 prometheus golang_client 官方的example
这段代码逻辑很简单:
- 初始化metric
- 设置metric对外的API
http.Handle("/metrics", promhttp.Handler()) - 随机生产demo metric 数据
3.1 初始化prometheus 的metric
在我的业务服务里面,我需要统计我的
- API/websocket的会话时间
- API/websocket被访问的次数
- API/websocket请求中返回error的次数
stat/prometheus.go
package stat

import (
	"github.com/prometheus/client_golang/prometheus"
)

var (
	// The same as above, but now as a histogram, and only for the normal
	// distribution. The buckets are targeted to the parameters of the
	// normal distribution, with 20 buckets centered on the mean, each
	// half-sigma wide.
	//GaugeVecApiDuration = prometheus.NewHistogram(prometheus.HistogramOpts{
	//	Name:    "HttpDuration",
	//	Help:    "api requset 耗时单位ms",
	//	Buckets: prometheus.LinearBuckets(0, 1000, 50),
	//})
	GaugeVecApiDuration = prometheus.NewGaugeVec(prometheus.GaugeOpts{
		Name: "apiDuration",
		Help: "api耗时单位ms",
	}, []string{"WSorAPI"})
	GaugeVecApiMethod = prometheus.NewGaugeVec(prometheus.GaugeOpts{
		Name: "apiCount",
		Help: "各种网络请求次数",
	}, []string{"method"})
	GaugeVecApiError = prometheus.NewGaugeVec(prometheus.GaugeOpts{
		Name: "apiErrorCount",
		Help: "请求api错误的次数type: api/ws",
	}, []string{"type"})
)

func init() {
	// Register the summary and the histogram with Prometheus's default registry.
	prometheus.MustRegister(GaugeVecApiMethod, GaugeVecApiDuration, GaugeVecApiError)
	// Add Go module build info.
	//processCollector := prometheus.NewProcessCollector(prometheus.ProcessCollectorOpts{Namespace:"Sys"})
	//goCollector := prometheus.NewGoCollector()
	//prometheus.MustRegister(processCollector)
}
需要注意的是golang prometheus client 已经内置了go runtime 和process相关的监控项,不需要再额外register
3.2 提供prometheus主程序收据收集的API接口
metric api服务是用过gin提供的
import (
	"github.com/gin-gonic/gin"
	"github.com/prometheus/client_golang/prometheus/promhttp"
)
...
	r := gin.New()
	r.GET("metrics", gin.WrapH(promhttp.Handler()))
3.3 设置数据收集埋点
3.3.1 通过gin middleware 收集api请求数据
把MwPrometheusHttp自定义的prometheus数据收集中间件,配置到gin路由上.
api := r.Group("api").Use(handler.MwPrometheusHttp)
handler/mw_prometheus_http.go
这里统计
- Request Method数量
- Request 在服务内部持续时间
package handler

import (
	"fortress/stat"
	"github.com/gin-gonic/gin"
	"time"
)

func MwPrometheusHttp(c *gin.Context) {
	start := time.Now()
	method := c.Request.Method
	stat.GaugeVecApiMethod.WithLabelValues(method).Inc()

	c.Next()
	// after request
	end := time.Now()
	d := end.Sub(start) / time.Millisecond
	stat.GaugeVecApiDuration.WithLabelValues(method).Set(float64(d))
}
3.3.2 在帮助函数中统计error的个数
package handler

import (
	"errors"
	"fmt"
	"fortress/stat"
	"github.com/gin-gonic/gin"
	"github.com/sirupsen/logrus"
	"net/http"
	"strconv"
)

func jsonError(c *gin.Context, msg interface{}) {
	//统计API发送错误的次数
	stat.GaugeVecApiError.WithLabelValues("API").Inc()
	var ms string
	switch v := msg.(type) {
	case string:
		ms = v
	case error:
		ms = v.Error()
	default:
		ms = ""
	}
	c.AbortWithStatusJSON(200, gin.H{"ok": false, "msg": ms})
}

func wshandleError(err error) bool {
	if err != nil {
		//统计websocket 中 发生的错误次数
		stat.GaugeVecApiError.WithLabelValues("WS").Inc()
		logrus.WithError(err).Error("handler ws ERROR:")
		return true
	}
	return false
}
4.配置prometheus
Docker 安装prometheus教程 installation/#using-docker
prometheus 主程序我们再这里就使用的她的时序数据库(Time Series Database)的功能.
每15s中获取一下/metrics接口统计的数据,没15s进行数据evaluation.
安装prometheus 设置配置文件如下
global:
  scrape_interval:     15s # Set the scrape interval to every 15 seconds. Default is every 1 minute.
  evaluation_interval: 15s # Evaluate rules every 15 seconds. The default is every 1 minute.

scrape_configs:
   - job_name: 'fortress'
     static_configs:
      - targets: ['dev.venom.mojotv.cn:3333'] #您的metric 服务地址
        labels:
         instance: fortress
5.安装配置grafana
这里我不推荐使用docker安装grafana,因为docker run grafana 自定义配置非常麻烦,需要修改的配置地方比较多
官方linux安装非常简单 https://grafana.com/grafana/download?platform=linux :
Ubuntu & Debian(64 Bit)SHA256: 7e2c05fb8c2b2595b7230cb34c3cd761891a4c3346e6d45518669d3946755e2d
wget https://dl.grafana.com/oss/release/grafana_6.3.3_amd64.deb
sudo dpkg -i grafana_6.3.3_amd64.deb
Standalone Linux Binaries(64 Bit)SHA256: ee3ea26e70ca1f144922f365418bd7f83dd931450a05be11e803db35e49f8e58
wget https://dl.grafana.com/oss/release/grafana-6.3.3.linux-amd64.tar.gz
tar -zxvf grafana-6.3.3.linux-amd64.tar.gz
Redhat & Centos(64 Bit)SHA256: c50e30aef112769df2b12ada41ab25c6cd90a544262643bd332e2ebfd35cd1a0
wget https://dl.grafana.com/oss/release/grafana-6.3.3-1.x86_64.rpm
sudo yum localinstall grafana-6.3.3-1.x86_64.rpm
Start the server (init.d service)
sudo service grafana-server start
开机启动grafana
sudo /sbin/chkconfig --add grafana-server
Start the server (via systemd)
$ systemctl daemon-reload
$ systemctl start grafana-server
$ systemctl status grafana-server
Enable the systemd service to start at boot
sudo systemctl enable grafana-server.service
配置文件路径
/etc/grafana/grafana.ini
日志文件路径
/var/log/grafana
Database路径
/var/lib/grafana/grafana.db.
自定义grafana配置文件
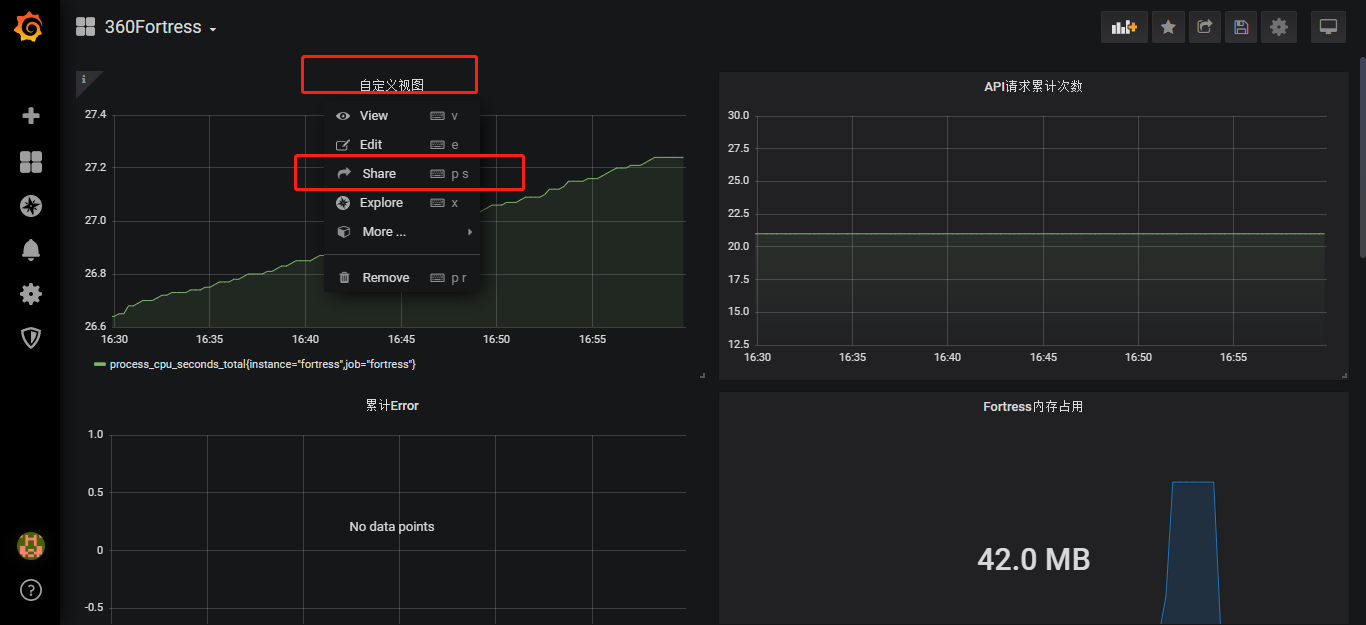
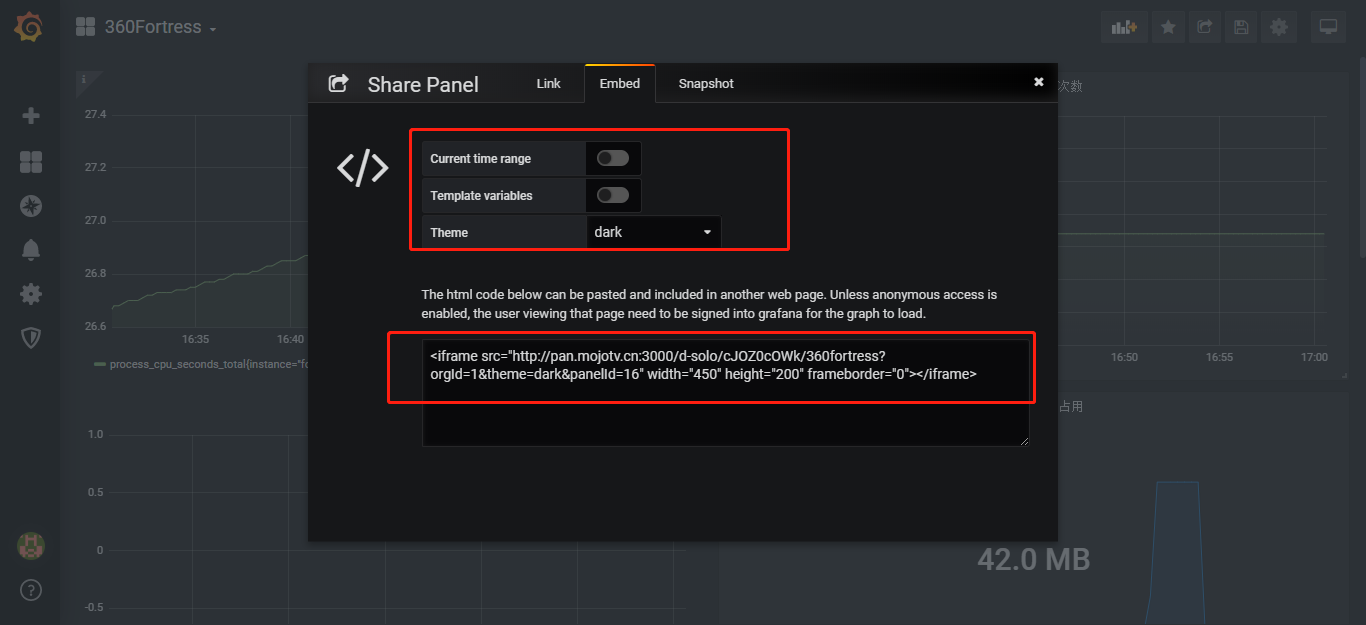
设置secure.allow_embedding true 容许iframe embed object 嵌套grafana图表
设置 auth.anonymous 文档地址 https://grafana.com/docs/auth/overview/#anonymous-authentication
这样您iframe 图表就不需要身份认证
[auth.anonymous]
enabled = true

# Organization name that should be used for unauthenticated users
org_name = Main Org.

# Role for unauthenticated users, other valid values are `Editor` and `Admin`
org_role = Viewer
连接prometheus数据源
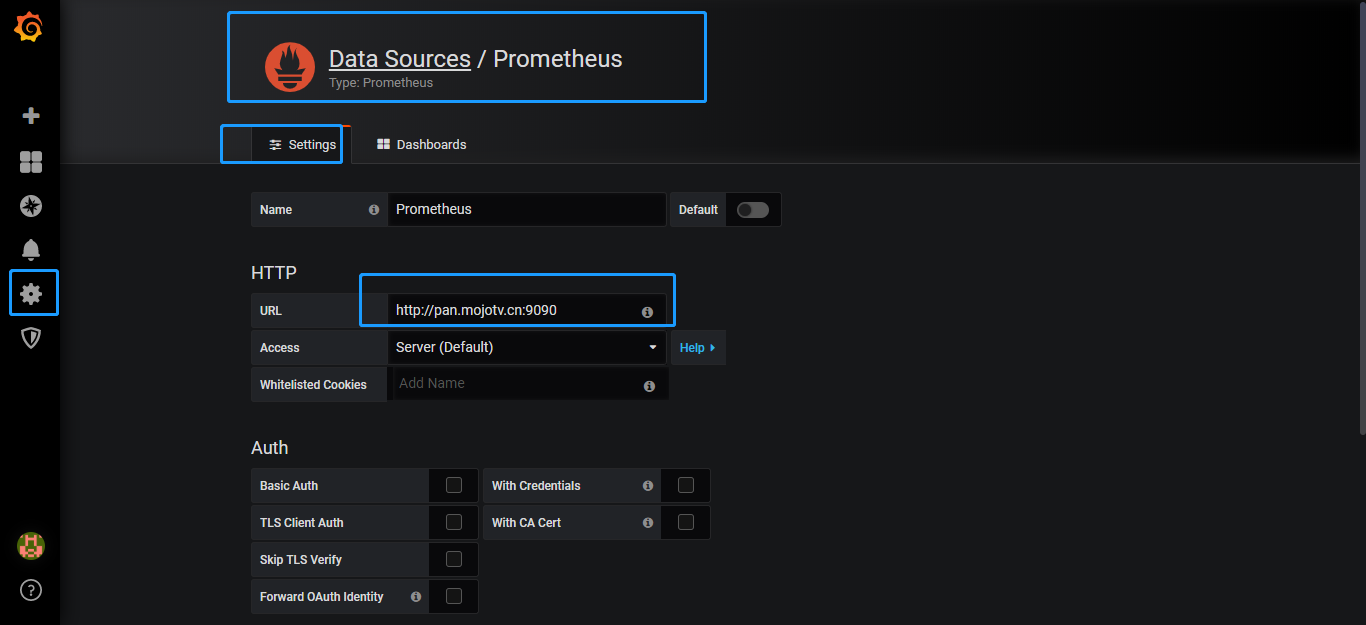
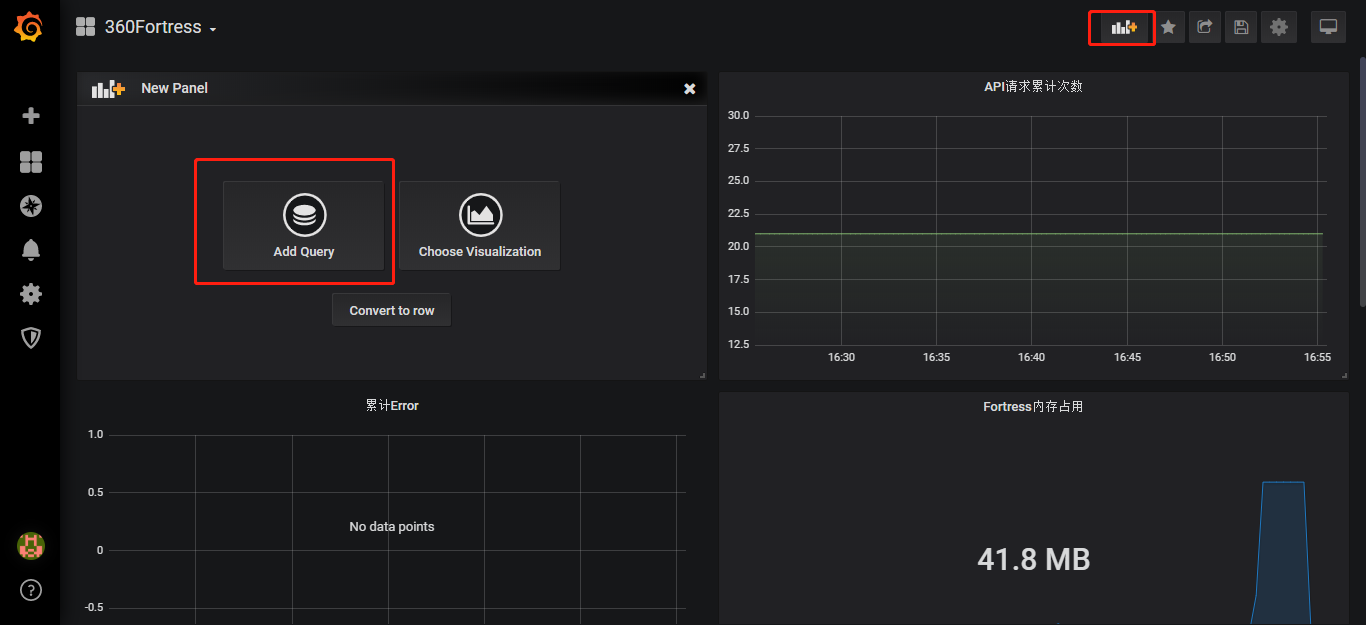
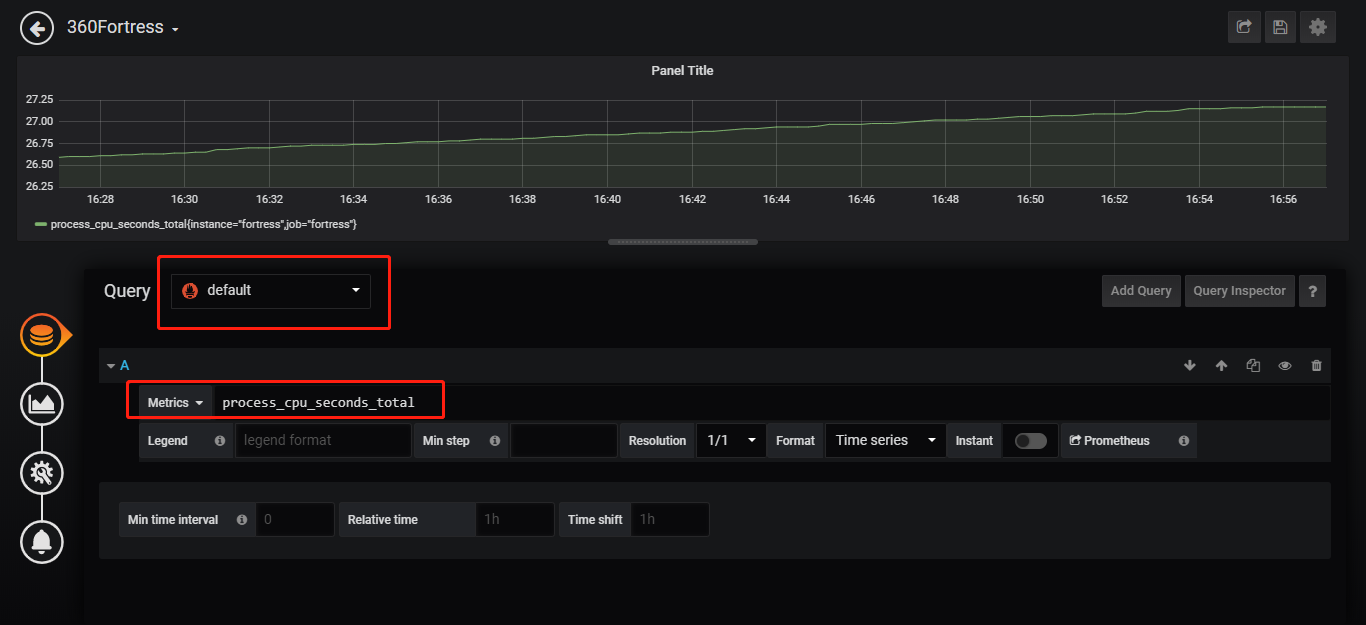
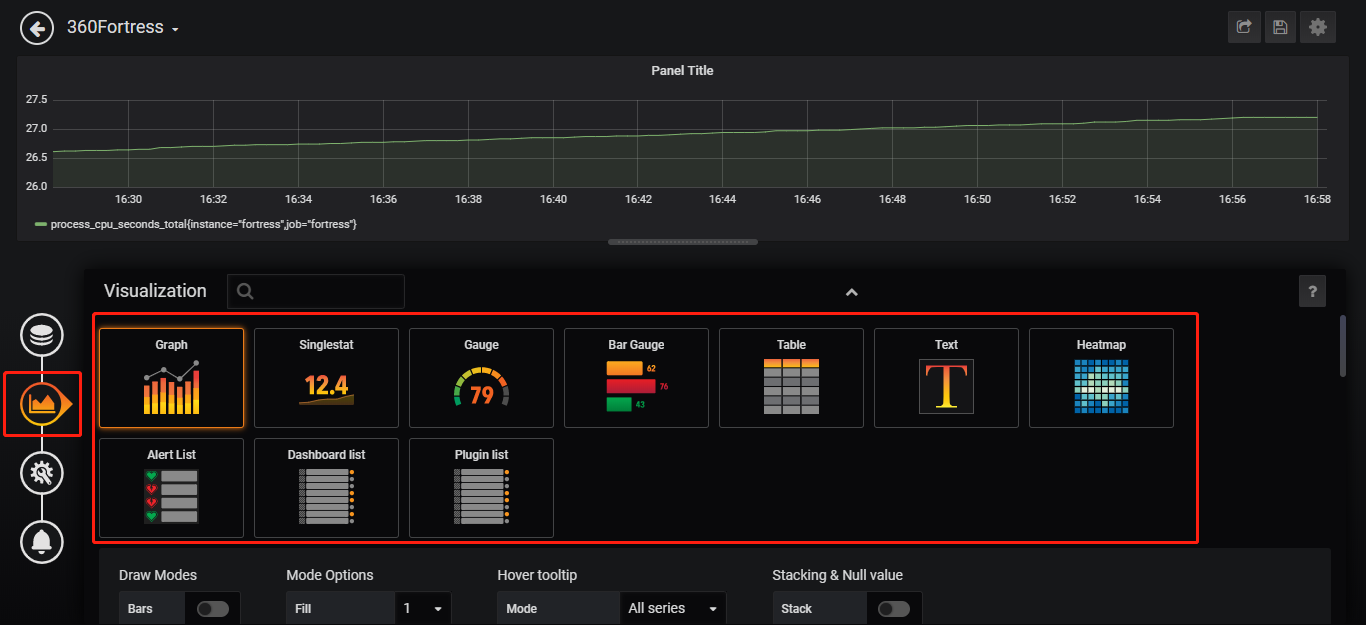
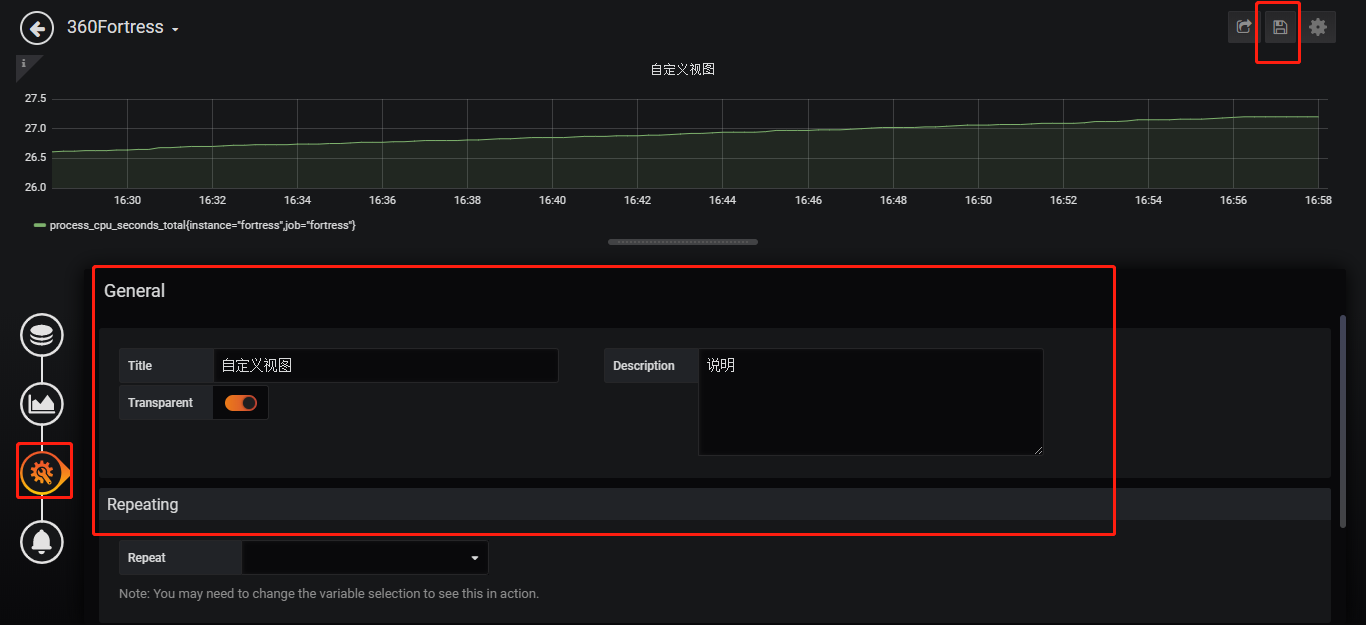
添加metric的图表